Build 02
Stock Indicator Dailies
Relates to any tool combining a computed output with a model-generated read: fraud scoring, risk assessment, anomaly detection. The choice to show disagreement instead of silently unilaterally making the decision holds regardless of the domain.
A stock analysis tool can compute technical indicators cleanly, MACD, moving averages, stochastics, but a computed signal only tells you what the math says, and misses the nuance that comes with looking at a chart. Relying on an AI read alone means trusting a system that can be fluent and wrong at the same time, confidently misreading a chart the same way it could confidently misread a document.
Neither source is trustworthy enough alone. The interesting problem wasn't picking one, it was building something that knew when they disagreed.
A full-stack tool that retrieves:
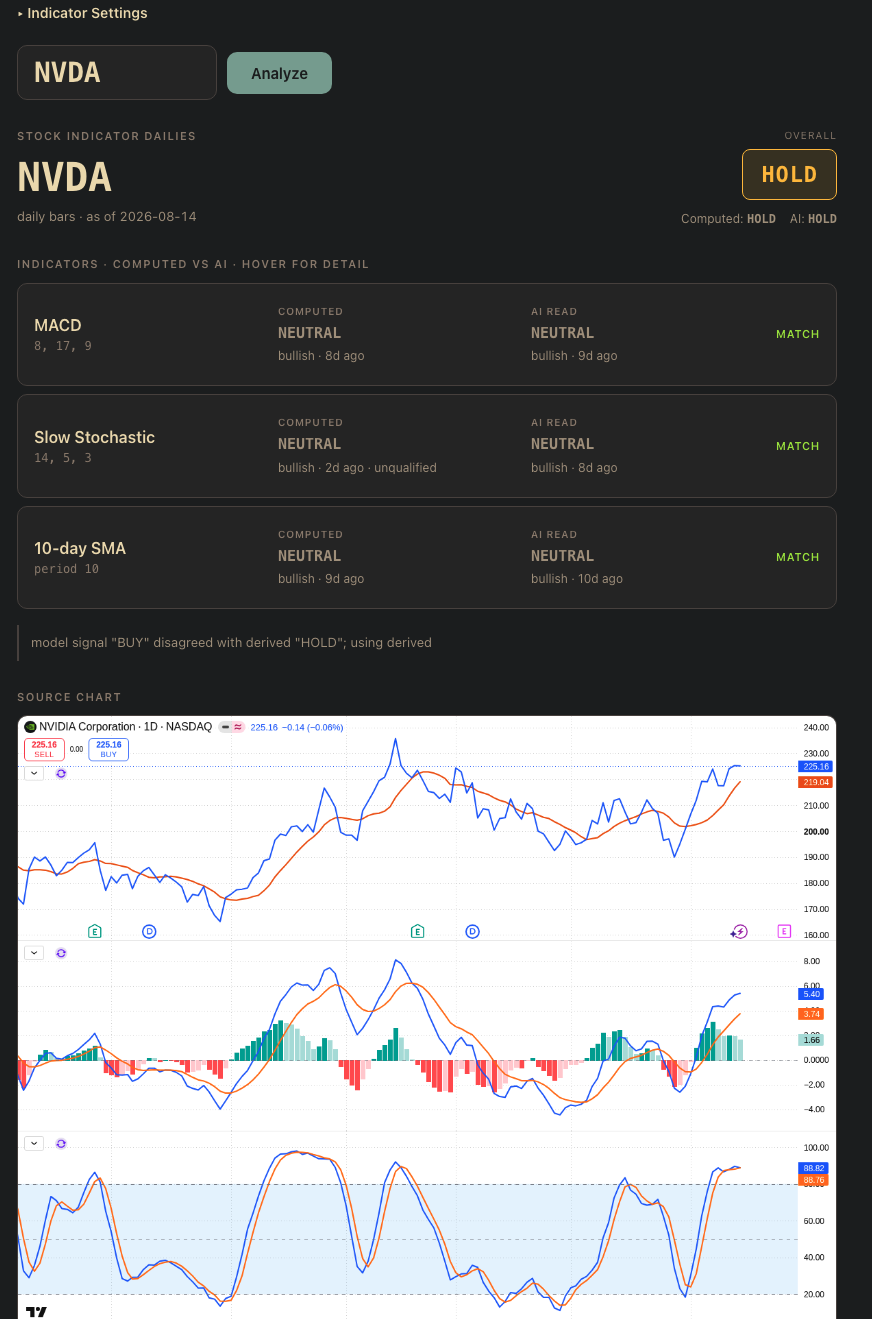
- Computed analysis: Retrieves daily price data and computes technical indicators via API.
- Chart retrieval and interpretation: Captures chart context through automated browser interaction via Playwright, then interprets it via an LLM visual-language model. The chart image is verified during the retrieval stage by the model to confirm it has no pop-ups and contains only the chart, no account information.
- Rule-based interpretation: Determines signal from both computed and chart-read results and compares the results to explicitly call out mismatches and proposes an overall indicator read.
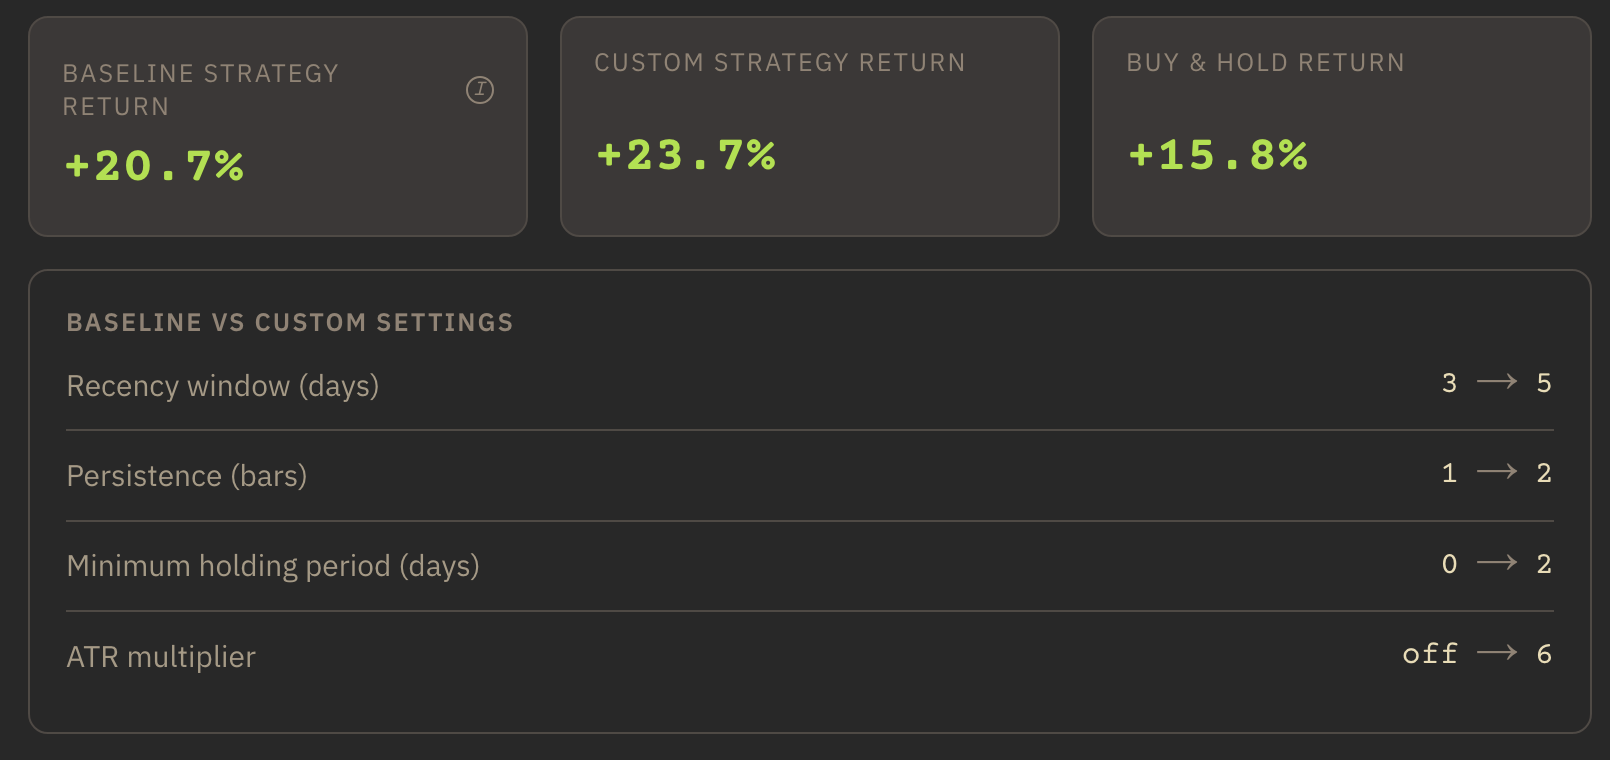
- Historical comparison: For the past two years of stock data, see how the buy or sell signal parameters performed over time.
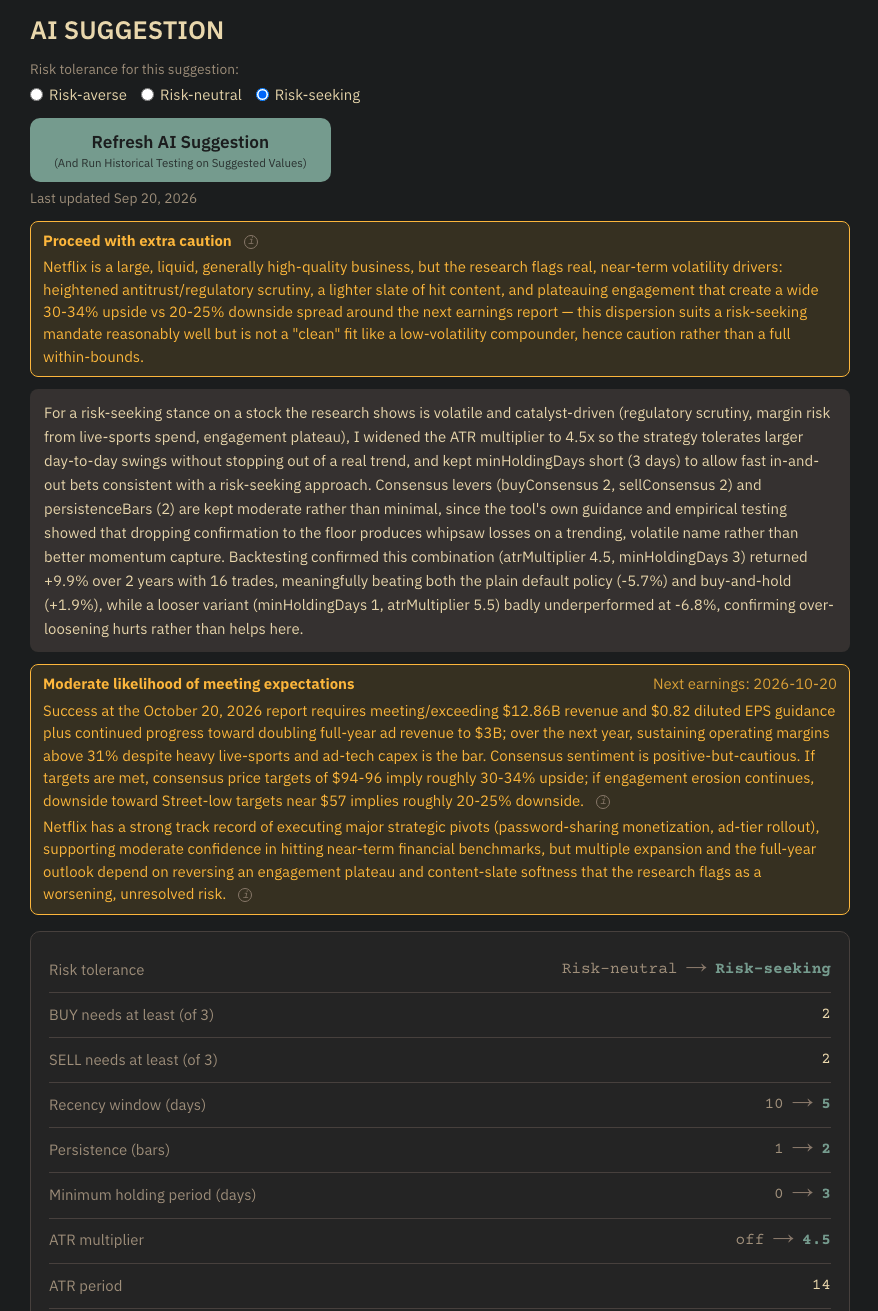
- Layered, structured research, not a single flat query: Four sequential search passes designed to use information gained to inform the next search. A check determines whether this depth of research is required, or if a lighter check on the cached research will do.
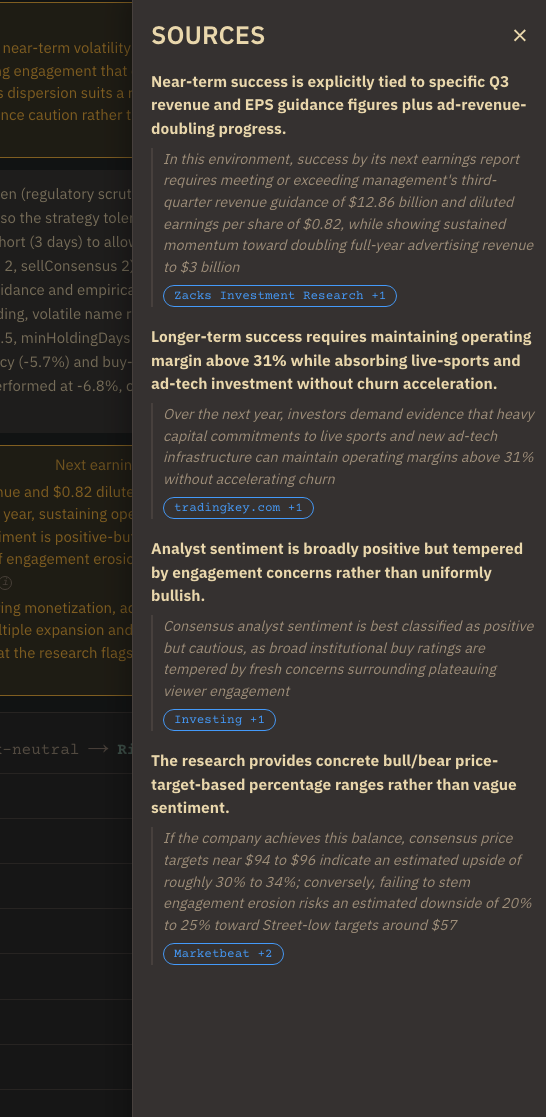
- Source-backed, validated outputs: Every synthesis carries its supporting sources, and time-sensitive facts are cross-checked against a second, independent source before being treated as confirmed.
- Agentic testing: Determines indicator settings based on the research and the user risk-tolerance level and tests potential settings up to three times before ultimately suggesting settings. The backtest for these settings can be observed in "Tuning and Historical Testing".
- Personalized, scheduled multi-user watchlist: Logged-in users can track their own watchlist, where every stock presents the overall, computed, and AI chart reads, refreshed automatically each weekday morning at 7 AM EST, no manual trigger required.
- Position tracking with a volatility-aware sell discipline: For any watchlisted stock, the app tracks realized and unrealized gain and loss against a user's reported entry and exit history, and computes a trailing sell point dynamically rather than a fixed percentage stop, so the exit threshold adapts to the stock's actual recent volatility instead of an arbitrary flat number.
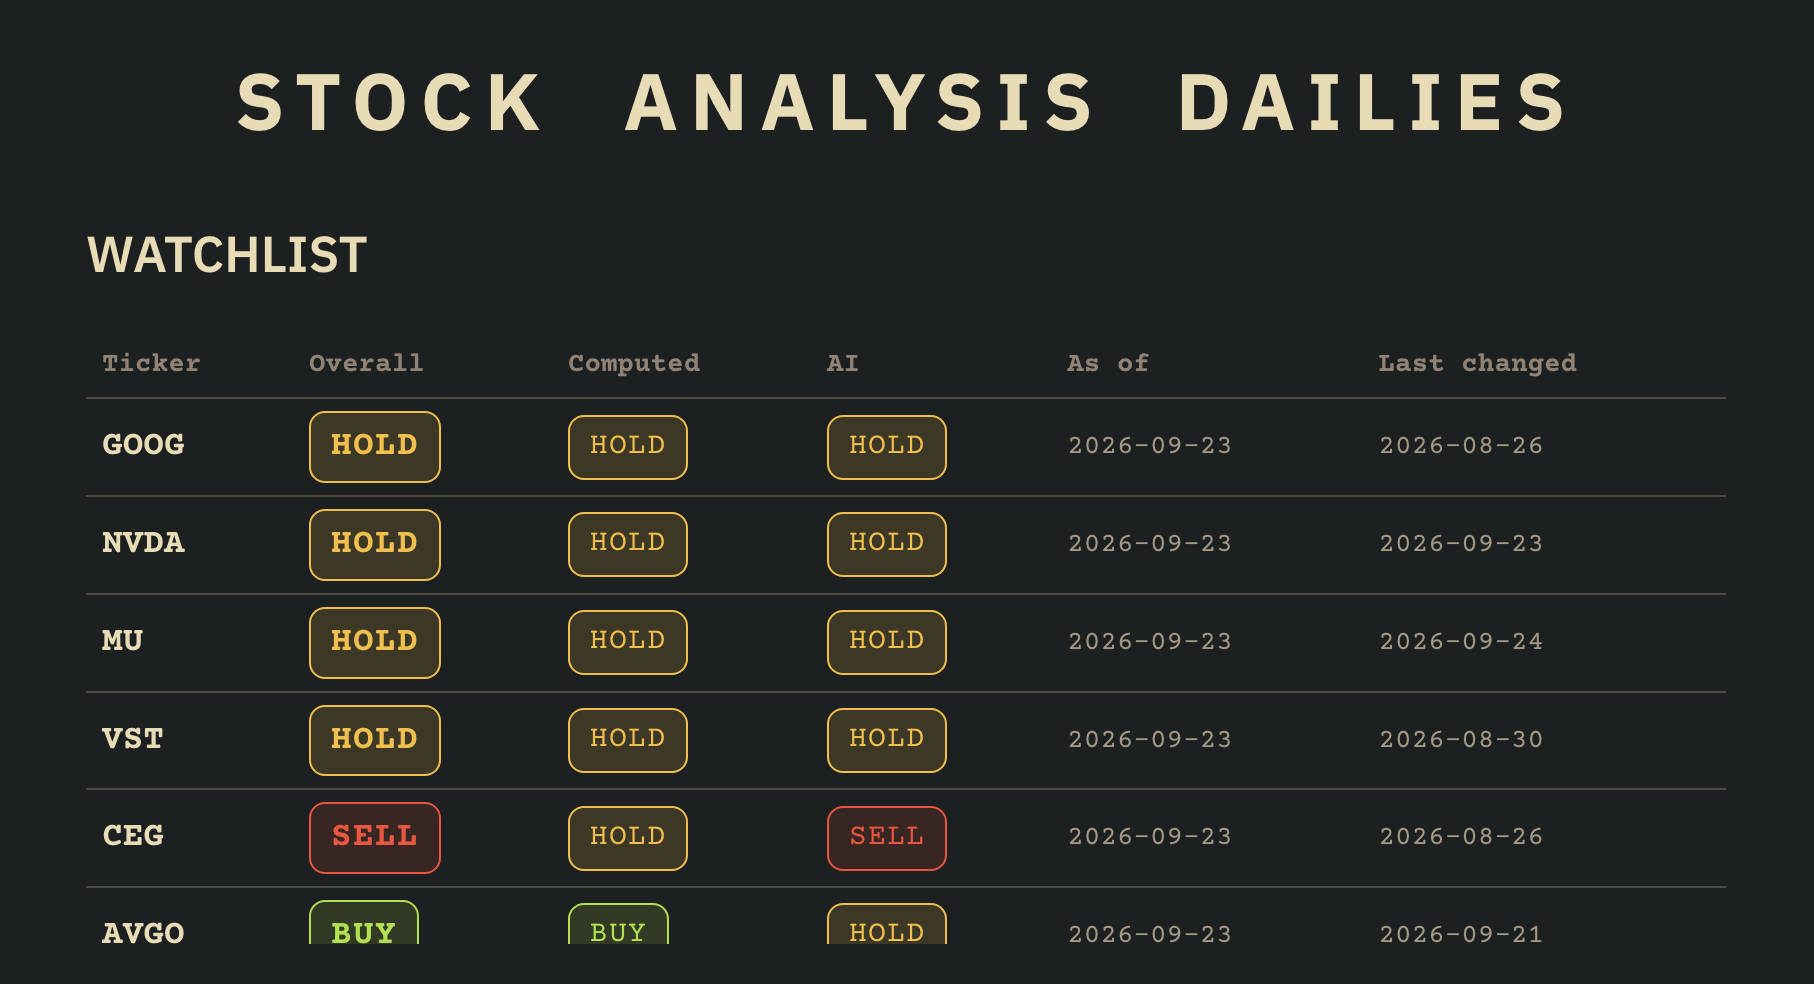
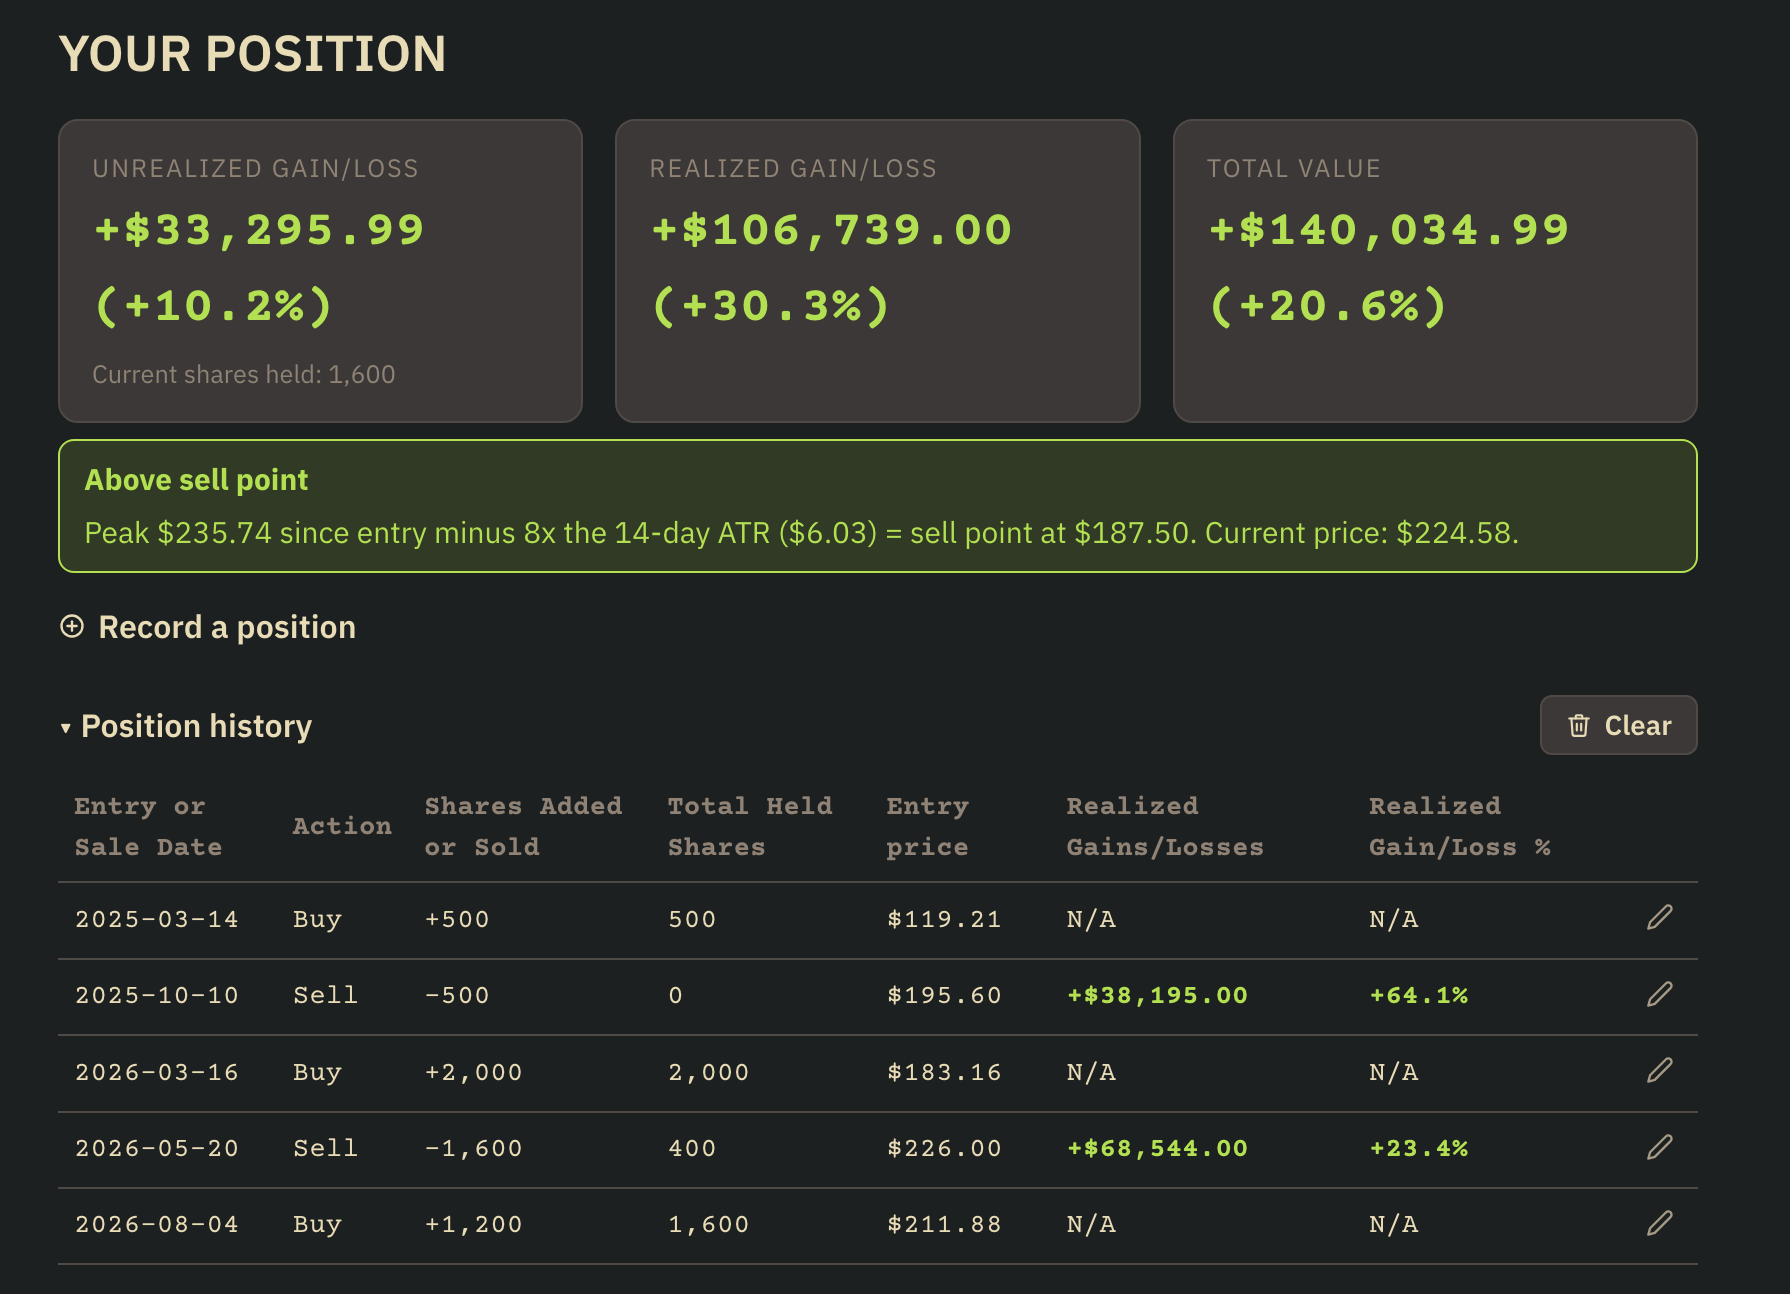
The easy version of this tool picks one source and reports it as the answer. That doesn't exactly empower the user to make decisions with the information it gives nor enables trust.
This principle is built into my product DNA: Simply reporting a result isn't trustworthy; you have to show your work to prove your hypothesis.
Showing both, and flagging when they diverge, does something a single blended output can't. It tells the user where to look closer instead of asking them to trust a synthesis they can't inspect. When the computed signal and the AI read agree, that agreement is itself informative. When they don't, that disagreement is crucial information and shouldn't be treated as noise that gets averaged away.
This is deliberately not a system that tells someone what to do. It's a data-acquisition and reporting tool, clearly labeled as such, built to surface signal and disagreement so a person can make their own call.
Any system pulling from two sources that can independently fail, a computation and a model, two models, a model and a human, faces the same choice. Merge them into one confident-sounding answer, or show the seam. Merging is more comfortable to look at and less honest. Showing the seam is what actually lets someone calibrate how much to trust the output.
I used the same instinct, don't resolve a disagreement silently, surface it, in no-API external retrieval automation, where a failed automated retrieval hands off to a human rather than quietly returning nothing.